Use the power of Checkly to monitor hundreds of pages in minutes.
This guide will show you how to monitor all the pages of your site, creating URL monitors and then deploying those checks with the Checkly CLI.
While you can create monitors from within the Checkly web UI, this tutorial will use the Checkly CLI and the principle of Monitoring as Code to create a new project as a code repository to contain all your uptime monitoring.
Set up your Checkly repository
Start by installing the Checkly CLI, then create a repository that will be the ‘project’ that contains all your Checkly monitors managed as code. If you don’t already have a project, create one with:
npm create checkly@latest
If you’d like to follow the tutorial examples below, clone the uptime monitoring demo repository, and copy everything in the /__checks__ folder to your own project.
Create URL Monitoring to check all your pages’ status codes
Checkly’s URL Monitors are the cheapest and fastest tool to just check the status code of a web page. They’re particularly useful for third-party services or pages that your service relies on. In general, a URL monitor will look like this:
//httpbinPinger.check.ts
import { Frequency, UrlMonitor, UrlAssertionBuilder } from 'checkly/constructs'

new UrlMonitor('url-pinger-1', {
  frequency: Frequency.EVERY_10S,
  name: 'URL pinger 1',
  activated: true,
  request: {
    url: 'https://httpbin.org/get',
    skipSSL: false,
    followRedirects: true,
    assertions: [
      UrlAssertionBuilder.statusCode().equals(200),
    ]
  }
})
Save this file in the /__checks__ directory. A couple important notes about the configuration of a URL monitor:
- The first string passed is the monitor’s logical ID, changing this value and running
checkly deploywill delete the previous monitor and create a new one. So generally this should remain static - This example contains a frequency. Without a frequency a new URL monitor will use your project default frequency
Read more in the full documentation of the UrlMonitor class.
Go ahead and create multiple URL monitors as separate files so we can try deploying more than one URL monitor at a time. If you’re envisioning monitoring dozens or hundreds of sites with URL Monitoring, don’t worry: you won’t have to create hundreds of files, a guide I’ll publish later this week will cover the bulk creation of monitors.

Test your monitors and deploy them to Checkly
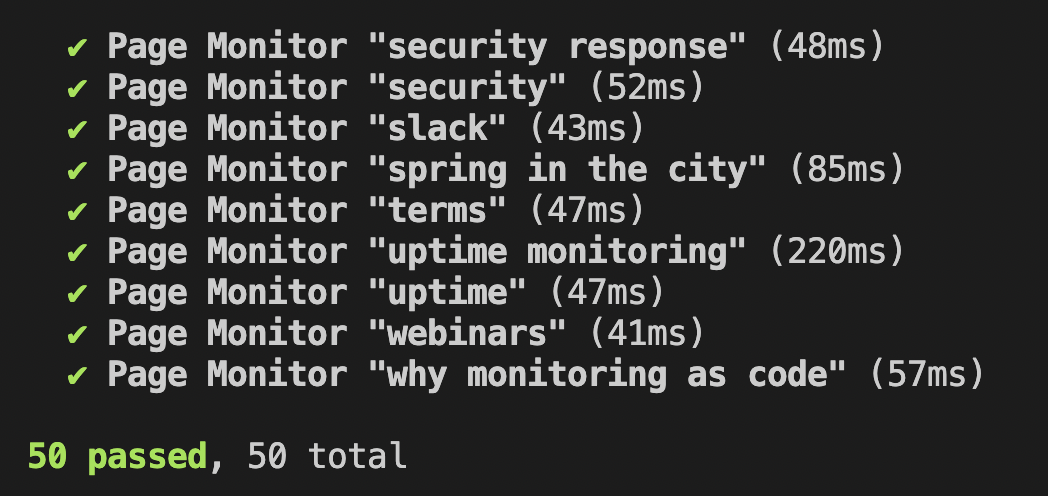
With our monitors written, lets run them all with npx checkly test .
The Checkly CLI will scan for every check.ts file in the /__checks__ folder and run them from the Checkly network.

One of the immediate benefits of using Checkly is evident here: since these monitors don’t run from your local workstation, you’ll be running these checks exactly like your users do, you can even configure the CLI to run the tests from multiple locations!
Once we’re happy with our test results, it’s time to deploy. To check that this deployment will go as planned, we can run the deploy command first with the preview flag -p . The preview flag lets see what monitors would be created if you would deploy them to the Checkly infrastructure. Especially if you’re creating monitoring resources dynamically, it’s recommended checking your resulting monitoring setup.
npx checkly deploy -p

Since we’re only adding URL Monitors in a new project, this should show only monitors being created. If anything else shows up, review your project settings before deploying.
When everything’s ready, deploy with
npx checkly deploy
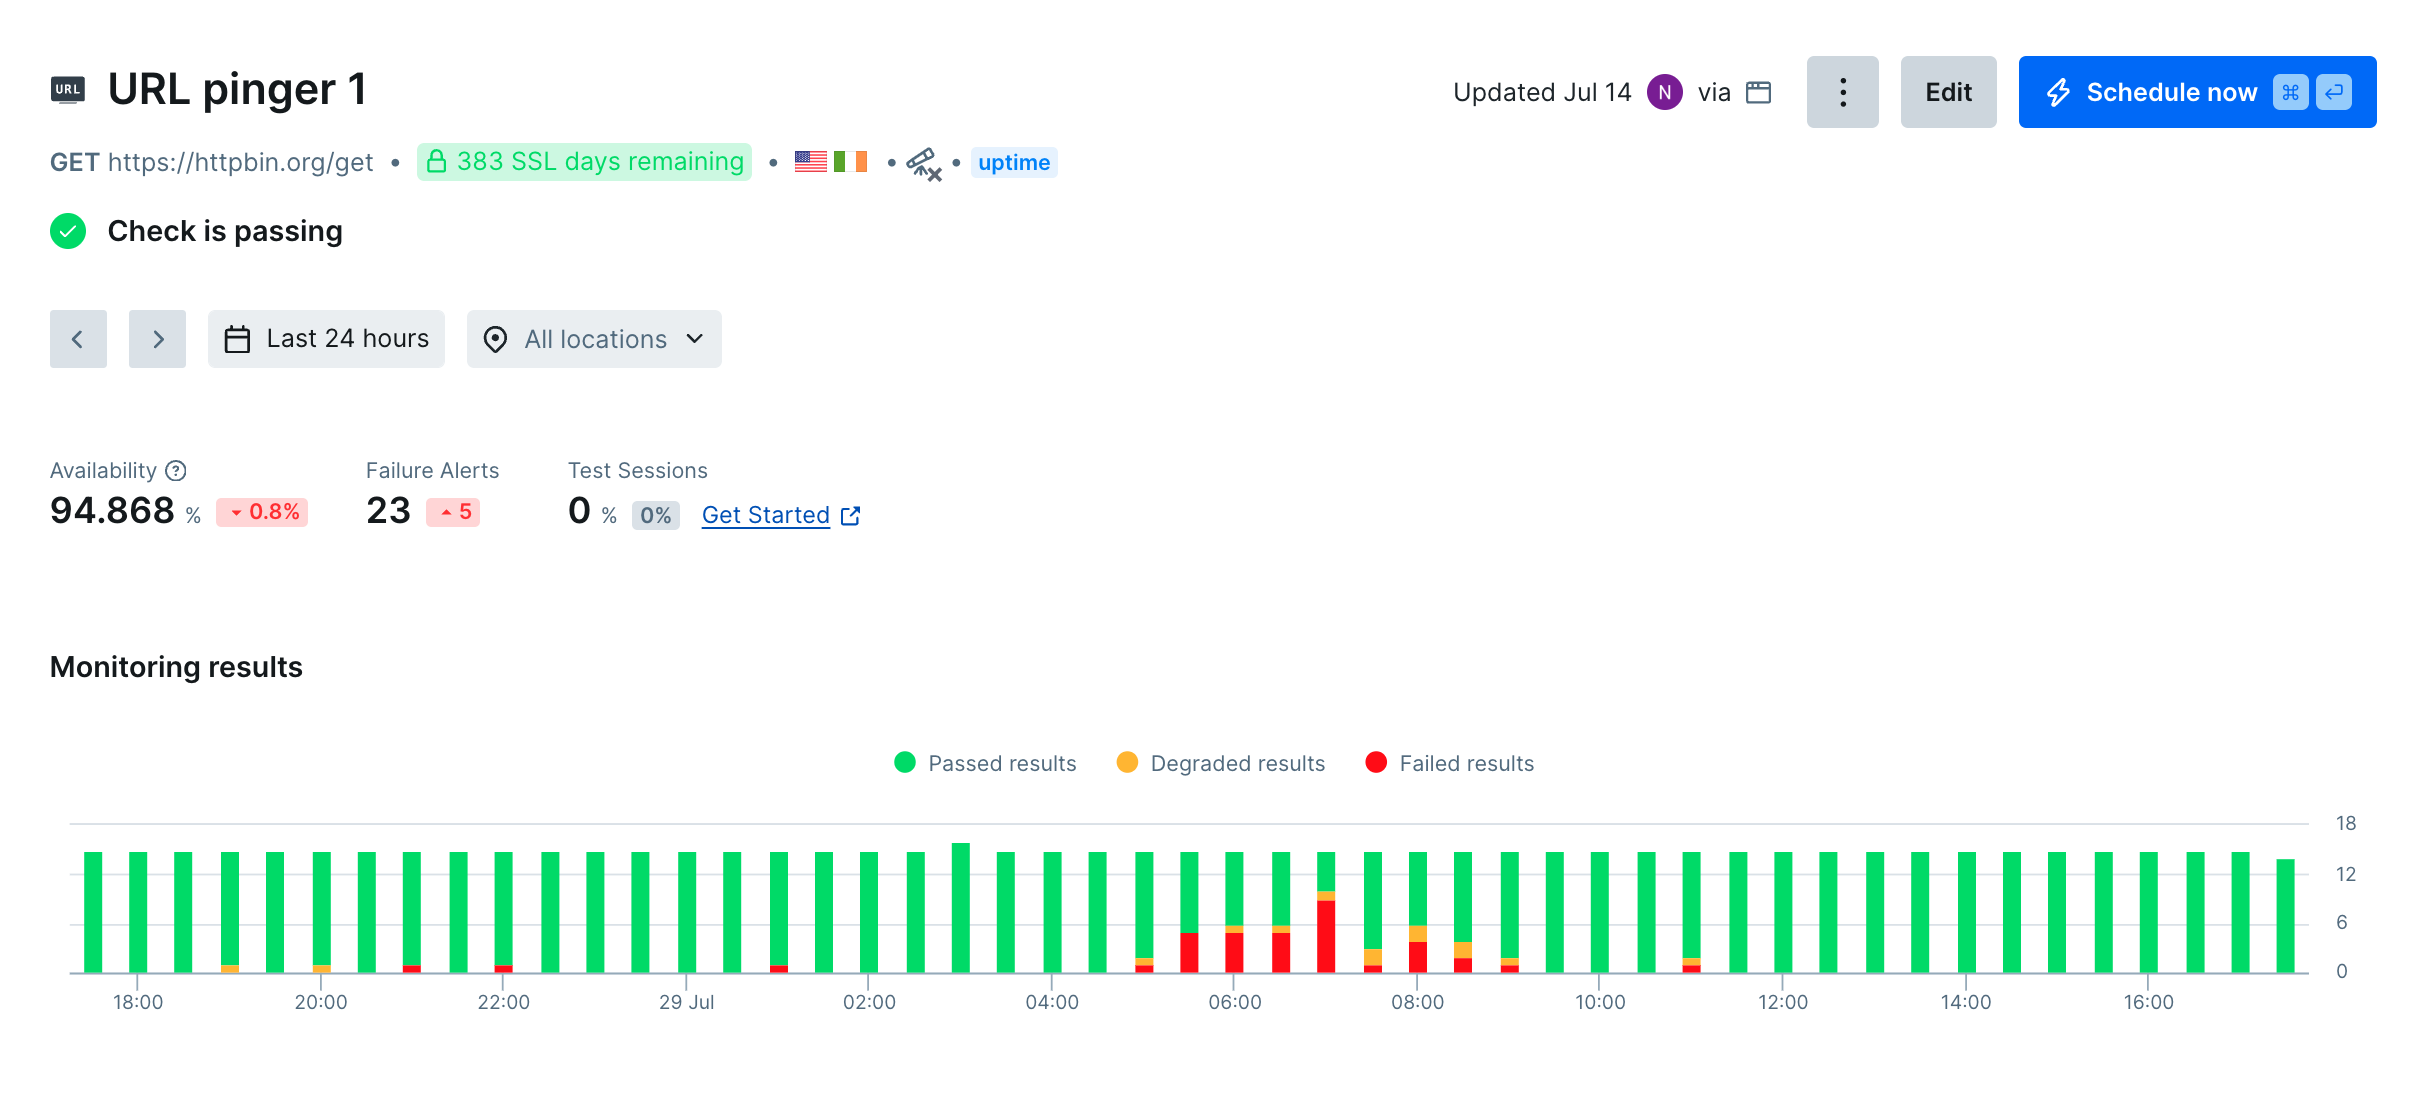
You’ll see a report very like the preview above, showing new monitors created. As the checks run, you’ll generate a dashboard in the Checkly UI.

Conclusion
With just a few commands, you’ve created a robust monitoring system that runs from Checkly’s global network rather than your local machine. This approach gives you the real user perspective your application monitoring needs. The Monitoring as Code methodology keeps your checks version-controlled and easily reproducible across environments.
Your URL monitors are now running continuously, providing immediate alerts when issues arise and historical data to track your site’s reliability over time. The Checkly dashboard gives you centralized visibility into all your endpoints, making it simple to spot patterns and respond quickly to outages.
As your monitoring needs grow, you can expand this foundation with browser checks or Playwright check suites for complex user flows, API monitoring for backend services, and bulk monitor creation for large-scale deployments. The CLI-first approach ensures your monitoring infrastructure scales alongside your applications.
Further Reading: Complete Uptime Monitoring
- To learn about all the new monitors offered by Checkly Uptime monitoring, check our complete guide on Uptime Monitoring.
- With this project you’ve started your Monitoring as Code journey, learn more in our guide to the Checkly CLI
- With these basic monitors set up, start creating synthetics checks in Playwright using Playwright Codegen.